The Ultimate Guide To Predict Your HYROX Race Time
Stop guessing your HYROX potential. This breakdown shows what “good times” really mean, where athletes actually lose minutes, and how to train smarter instead of chasing misleading benchmarks.
Train for Real Gains, Not Average Times
HYROX benchmarks don’t account for your strengths, fatigue patterns, or race-day pacing. ChAIron adapts your training to your performance data, helping you fix the exact stations and running segments that cost you the most time.
If you’re comparing your HYROX finish time to online averages without accounting for division, age, fatigue profile, and station efficiency, you’re missing the full picture.
Most HYROX time benchmarks don’t explain why athletes slow down, or where they lose the most time.
ChAIron doesn’t just show benchmarks. It predicts your realistic HYROX time based on running fitness, strength decay, station execution, and recovery under fatigue, then adapts your training to close the exact gaps holding you back.
TL;DR
A “good” HYROX time isn’t universal. It depends on your division, age, fatigue profile, and how you execute stations, not just your finish number.
HYROX averages are misleading because they hide fatigue accumulation, pace decay, and transition inefficiency across the race.
Running makes up ~45–55% of HYROX, but performance is decided by how well you preserve pace under fatigue, not how fast you run fresh.
The biggest time losses come from Roxzone transitions, sled pull inefficiency, and wall balls breaking down under exhaustion, not lack of strength alone.
ChAIron predicts your realistic HYROX time using real training data, identifies exactly where you lose minutes, and adapts training so benchmarks become milestones, not pressure.
What Is a “Good” HYROX Time, really?
A “good” HYROX time depends on who you are, not a single average.
Most published benchmarks lump together:
First-timers and repeat competitors
Different age groups
Athletes with wildly different running vs strength profiles
At ChAIron, we have seen that two athletes finishing in 1:30:00 can arrive there in completely different ways:
One bleeds time on running after sleds
Another collapses at wall balls and Roxzone transitions
Same finish time. But entirely different athlete.
Why Do HYROX Average Times Mislead Most Athletes?
Because averages hide fatigue. HYROX is not eight 1K runs plus workouts. It’s progressive physiological decay.
Most public benchmarks fail to account for:
Running pace drop-off after stations
Grip, quad, and core fatigue accumulation
Transition inefficiency (Roxzone is a silent killer)
ChAIron models how your pace changes after each station, not just how fast you run fresh.
How Much of HYROX Is Actually Running?
Roughly 45–55% of total race time is spent running. But here’s the catch:
Elite athletes maintain run pace within ~5–8% variance
Average athletes lose 20–35% pace by the final runs
This is why ChAIron prioritizes:
Run–station coupling workouts
Fatigue-aware pacing
Aerobic durability, not just speed
If your 5K PB looks good but your late-race runs implode, ChAIron flags that mismatch early.
Which HYROX Stations Cause the Biggest Time Losses?
Across race data and athlete logs, the biggest time leaks consistently come from:
Roxzone Transitions: Most athletes lose 3–6 minutes here without realizing it.
Wall Balls: Leg power + breathing rhythm under exhaustion, not raw strength.
ChAIron tracks station-specific slowdown patterns and rewrites your training emphasis week by week.
How Do Elite HYROX Athletes Train Differently?
They don’t just “train harder.” They train more predictably.
Elite athletes:
Maintain run economy under load
Minimize transition hesitation
Break stations strategically before failure
ChAIron encodes these patterns into adaptive programs, so non-elites don’t have to guess.
Where Is HYROX Time Actually Won or Lost?
This is where HYROX performance stops being abstract and becomes painfully specific.
When you break the race down station by station, the difference between elite and average athletes isn’t just fitness. It’s fatigue management, execution quality, and decision-making under stress.
Let’s decode exactly where time disappears:
Run
Elite
Average
Gap
What’s Really Happening
Run 1
03:24
03:44
00:20
Fresh legs, minimal separation
Run 2
03:40
04:43
01:03
SkiErg taxes upper-body breathing
Run 3
03:54
05:37
01:43
Sled push crushes quads
Run 4
03:50
05:37
01:47
Cumulative fatigue compounds
Run 5
03:55
05:33
01:38
Post-burpee nervous system stress
Run 6
03:50
05:21
01:31
Aerobic durability gap widens
Run 7
03:58
05:32
01:34
Mental and physical breakdown
Run 8
04:15
06:19
02:04
Racing vs survival mode
Total Running: Elite: 30:46 | Average: 42:26 → 11:40 lost purely on runs
Chairon Insight
This is not a speed problem. It’s a fatigue-resistance problem.
ChAIron tracks how your run pace decays after specific stations, so training focuses on preserving pace late, not just running fast fresh.
Elite athletes don’t win by being stronger. They win by never letting a station spiral.
ChAIron programs deliberately train non-failure execution, ending sets before breakdown, preserving the nervous system for what’s next.
How Do Women’s Running Gaps Compare to Men?
Women show more consistent pacing, but the gaps still grow steadily.
Run
Elite
Average
Gap
What This Tells Us
Run 1
03:38
04:46
01:08
Larger early gap than men
Run 2
04:07
05:14
01:07
Fatigue hits sooner
Run 3
04:22
05:28
01:06
Steady differential
Run 4
04:24
05:29
01:05
Pacing discipline holds
Run 5
04:28
05:39
01:11
Post-burpee impact
Run 6
04:22
05:37
01:15
Accumulated fatigue
Run 7
04:23
05:39
01:16
Mental toughness gap
Run 8
04:43
06:17
01:34
Final effort vs damage control
Total Running: Elite: 34:27 | Average: 44:09 → 9:42 difference
Chairon Insight
Women lose slightly less time late, but still suffer when station fatigue isn’t managed properly. Run durability remains the primary performance lever.
Which Stations Hurt Women the Most?
Station
Elite
Average
Gap
Key Insight
SkiErg
04:12
04:51
00:39
Technique over raw power
Sled Push
03:00
03:48
00:47
Positioning still decisive
Sled Pull
03:54
06:36
02:42
Technique is everything
Burpee Broad Jumps
03:11
04:53
01:42
Power endurance gap
Row
04:29
05:12
00:43
Breathing rhythm matters
Farmers Carry
01:57
02:45
00:48
Grip fatigue
Sandbag Lunges
03:35
05:25
01:50
Form under fatigue
Wall Balls (75)
03:50
06:20
02:30
Rhythm collapse
Roxzone
03:47
06:12
02:25
Recovery inefficiency
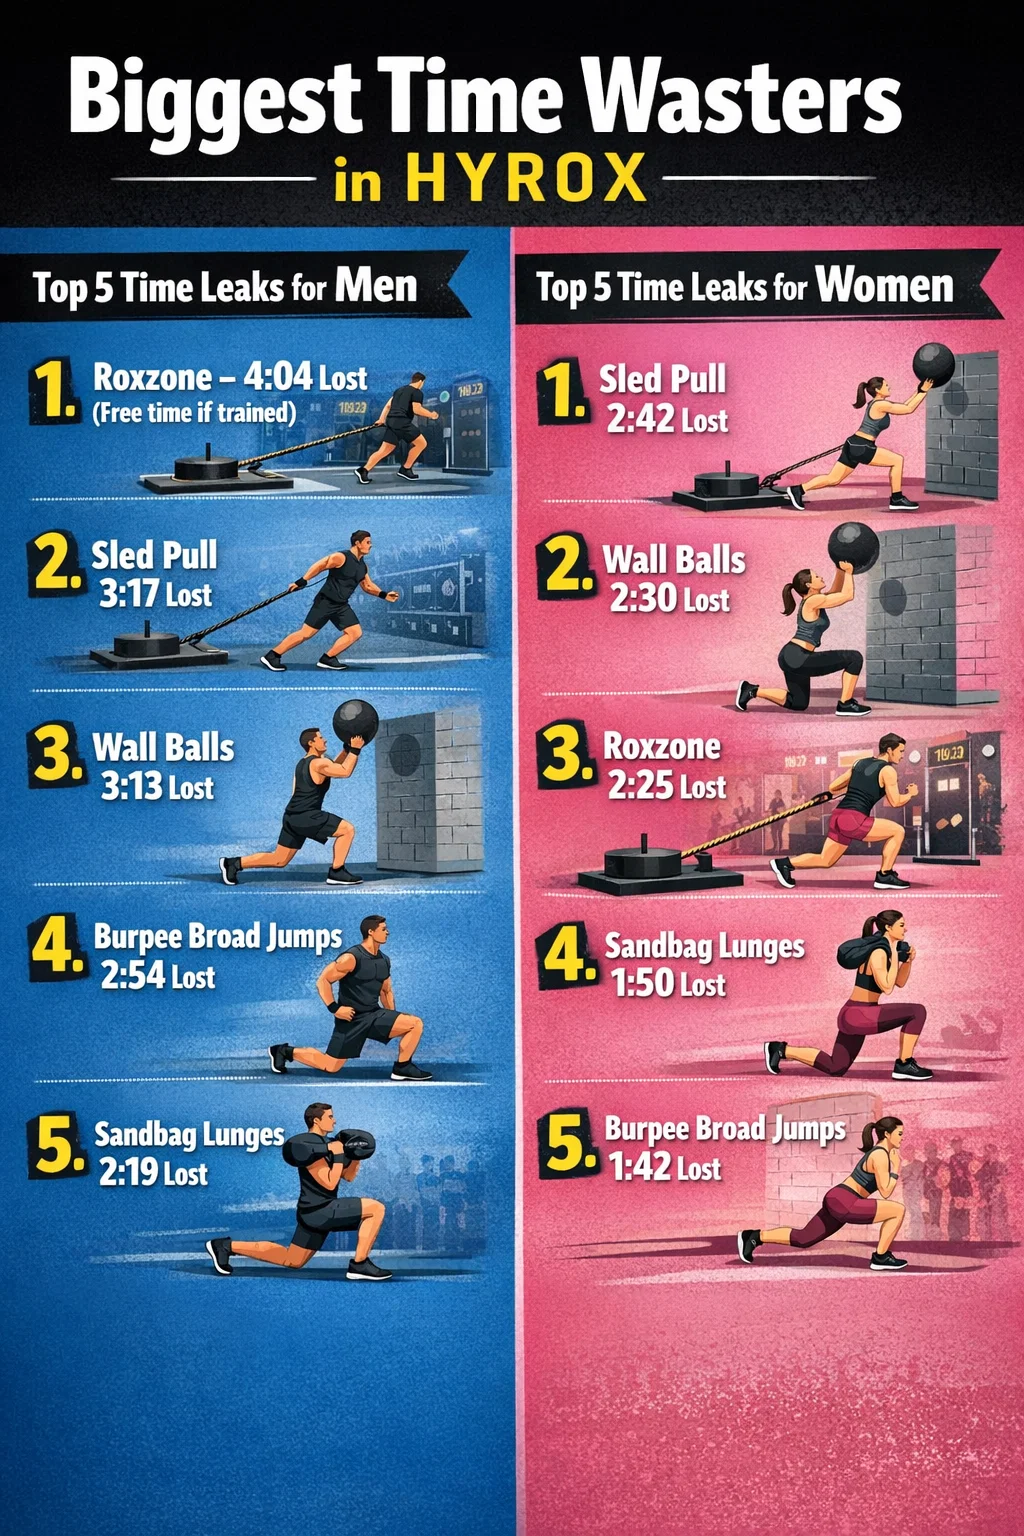
What Are the Biggest Time Wasters in HYROX?
Top 5 Time Leaks for Men
Roxzone – 4:04 lost (free time if trained)
Sled Pull – 3:17 lost
Wall Balls – 3:13 lost
Burpee Broad Jumps – 2:54 lost
Sandbag Lunges – 2:19 lost
Top 5 Time Leaks for Women
Sled Pull – 2:42 lost
Wall Balls – 2:30 lost
Roxzone – 2:25 lost
Sandbag Lunges – 1:50 lost
Burpee Broad Jumps – 1:42 lost
Why is Roxzone the Highest ROI Fix?
Here’s the uncomfortable truth: You can shave 2–4 minutes off your HYROX time without getting fitter.
Elite athletes average under 3 minutes total in Roxzone. Average athletes take 6–7 minutes, not because they’re tired, but because they’re unprepared.
Chairon Advantage
ChAIron trains:
Transition rehearsals
Equipment familiarity
Cognitive calm under fatigue
Roxzone stops being chaos and becomes a controlled reset.
Can You Predict Your HYROX Time Before Race Day?
Yes, if you stop guessing.
ChAIron predicts your race-day time accurately by using:
Your recent run splits
Strength-endurance decay curves
Station completion consistency
Recovery between efforts
This is why two athletes with identical 5K times can receive very different HYROX predictions.
Why Doesn’t ChAIron Use Generic HYROX Benchmarks?
Because static benchmarks don’t improve athletes.
ChAIron benchmarks are:
Personal (based on your logged training)
Dynamic (they change as you adapt)
Actionable (each prediction ties to a training lever)
Instead of asking, “Is 1:30 good?”, ChAIron answers, “Here’s how you reach 1:25, and what’s stopping you right now.”
How Should First-Time HYROX Athletes Use Benchmarks?
Benchmarks should guide expectations, not ego.
For first-timers, ChAIron recommends:
Completion-first mindset
Conservative early pacing
Transition rehearsal over brute fitness
Your first race sets your training baseline, not your ceiling.
What Does Real Progress Look Like in HYROX Training?
Real progress isn’t just a faster finish time.
It’s:
Smaller pace drop-offs late in the race
Cleaner transitions
Fewer unplanned breaks
Stronger final stations
ChAIron tracks these signals automatically, so improvement is visible long before race day.
How Does ChAIron Help You Beat Benchmarks Instead of Chasing Them?
ChAIron doesn’t motivate with averages. It builds certainty.
By combining AI-driven analysis with real training data, ChAIron:
Predicts realistic HYROX outcomes
Identifies your highest ROI improvements
Adapts weekly as your body changes
Benchmarks stop being pressure. They become milestones you hit on schedule.
What Should You Take Away From This Breakdown?
HYROX isn’t lost at one station. It’s lost through small inefficiencies that compound.
The athletes who improve fastest:
Lose less pace late
Avoid station failure
Move decisively between efforts
That’s exactly what ChAIron is built to train, automatically.
Pro tip: Use our free HYROX race time calculator to plan your station-by-station splits and optimize your race time
From Roxzone transitions to sleds and wall balls, ChAIron pinpoints the movements and pacing mistakes that separate average finishes from personal bests and builds your plan around closing those gaps.

.jpg)
.png)
.png)